Sunday, March 31, 2013

Positive Energy is Achievable...


In this post, I will summarize my research that I have presented as a short paper in a class lecture.  At the first time, the goal was investigating a net zero energy (NZE) building or house.  I had to find two case studies that claim NZE in their applications.  However, the results of my case studies were showing the tendency of reaching positive energy instead of net zero energy.  It is clear that NZE house means the house that can produce energy that is equal to its energy consumption.  NZE has an important role as the continuation of sustainable construction.  The terminology is a concrete framework that covers the next stage of application of sustainable construction principals.  


Case studies

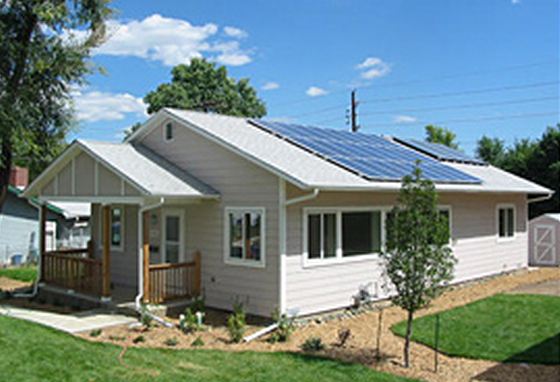
Picture 1 NREL Habitat NZE House
Photograph courtesy of NREL
The first case study is a test house from National Renewable Energy Laboratory (NREL), located in Denver.  Based on the report from NREL (2010), the one story type zero energy house (ZEH) Habitat (see Picture 1) is placed on a 119 square meter area with general specifications consist of combination of natural gas (NG) for cooking, space heating and clothes drying; ground-coupled heat pump (GCHP), solar thermal for radiant heating and cooling purpose; envelope system with all low emissivity glasses.  In addition, the lighting system uses compact fluorescent light (CFL) bulbs for the entire house and the use of all Energy Star® appliances.  Although the uses of NG is said to be debatable for the renewable energy point of view, the houses will offset the use of NG with the electricity that can be produced via photovoltaic (PV) system.  This house is inhabited by one adult with two children.  General results for annual data of this test house can be summarized in Table 1.
Table 1 NREL Annual Test House Results
From column [2] above, the energy that can be produced is 1,767.8 kWh.  Based on the consumption data, the annual consumption for this house is 51 kWh/m2.year.  If we divided with the total area of the test house the net electricity production is 14.8 kWh/m2.year.    


The second case study is a test house from Denmark.  This house was completed in 2010 as the first experimental project from VKR Holding, based in Horseholm, Denmark (see Picture 2).  The floor area is about 189 square meters and occupied by two adults with three children.  The house has 50 square meter of solar panels that produce 5,500 kWh per year; 6.7 square meters copper plate solar thermal collectors for the heating system both space and water heating.  

Picture 2 Active House Denmark
Photograph courtesy of VKR Holding-Denmark
A heat pump system is used for the space heating purpose as well as the installation of energy efficient appliances.   In this case study, no energy consumption data has been provided.  However, the average single family electricity consumption in Denmark about 47 kWh/m2.year can be used (this number yields to 8,883 kWh annually after multiplying with 189 square meters area).  Table 2 below, column [2] contains the developer data claimed by VKR-Holding.  
Table 2 Annual Consumption for Active House-Denmark
Again, if we divided with the test house area, the test house electricity production yield to 15.43 kWh/m2.year.

Both case studies confirm a very tight results of energy production per square meters per year which are positive.
In conclusion, these case studies show a promising advance step beyond just a NZE house.  These facts prove that the net positive energy can be achieved surpassing the claim of net zero energy.  Of course, the exceeded energy can be either sold back to the utility grid  or used for other household purposes.

NB:  Green Act: 8.4 miles  = 0.280 gallons oil
        Cumulative 72 miles  = 2.385 gallons oil


Tuesday, March 19, 2013

Green Building Evaluation System


New Construction
At this point, I will try to compare the criteria for achieving credits between USGBC LEED rating system and Indonesia GREENSHIP.  In the GREENSHIP, there are two rating points achievable—Design Recognition Assessment (DR) and Final Assessment (FA).
Indonesia GREENSHIP has also referred to LEED system as its fundamental basis.  For each parameter, there will some criteria and from both systems, there are some slight differences in the checklist form.  However, the criteria formed are typical.  Below table is briefly summarizing the comparison of those two rating systems.

Table 1 Comparison LEED-GREENSHIP Indicators
No
LEED
Achievable Points
Pre-requisite
Criteria Credits
No
GREENSHIP [FA]
Achievable Points
Pre-requisite
Criteria Credits
I
Sustainable Sites
26
1
14
I
Appropriate Site Development
17
1
7
II
Water Efficiency
10
1
3
II
Energy Efficiency and Conservation
26
2
4
III
Energy and Atmosphere
35
3
6
III
Water Conservation
21
2
6
IV
Materials and Resources
14
1
8
IV
Materials Resource and Cycle
14
1
6
V
Indoor Environmental Quality
15
2
15
V
Indoor Health and Comfort
10
1
7


VI
Building Environmental Management
13
1
7
TOTAL
100
8
46
TOTAL
101
8
37


*VI
Innovation in Design
6 (bonus)

2
*II
Energy Efficiency and Conservation
5 (bonus)

1
*VII
Regional Priority
4 (bonus)

1


TOTAL
110

49
TOTAL
106

38

The grayed out rows refer to applicable bonus that can be implemented in the project.  For the certification system, GREENSHIP also follows the method that is used by LEED.  It seems that the achievable points are different in each criterion therefore the point assessment are also different.  In LEED, the bonus points can be obtained in two indicators, i.e. Innovation and Design and Regional Priority.  Meanwhile, the bonus point for GREENSHIP can be obtained only from Energy Efficiency and Conservation indicator.  Since this is the bonus, the GREENSHIP system gives bonus point to the installation of on-site renewable energy system.

Table 2 Comparison LEED-GREENSHIP [FA] Points
LEED
GREENSHIP [FA]
Certification Award
Points Required
Certification Award
Points Required
Platinum
40-49
Platinum
≥ 74
Gold
50-59
Gold
58 ≤ Points < 74
Silver
60-79
Silver
47 ≤ Points < 58
Certified
≥ 80
Bronze
35 ≤ Points < 47

Below table presents the DR achievable points from GREENSHIP evaluation system. 

Table 3 GREENSHIP [DR] Points
No
GREENSHIP [DR]
Achievable Points
I
Appropriate Site Development
17
II
Energy Efficiency and Conservation
26
III
Water Conservation
21
IV
Materials Resource and Cycle
2
V
Indoor Health and Comfort
5
VI
Building Environmental Management
6
TOTAL
77


*II
Energy Efficiency and Conservation
5 (bonus)
TOTAL
82


The design recognition is intended to the design phase of the building.  Here, the project has not been executed.  Eventually, it can be seen from the specific guideline in the portion of Materials and Resource Cycle.  The all materials criteria might not be counted since this is still only the design.  It means the DR system can be extended to the FA system after the project has been completed. 

Table 4 GREENSHIP [DR] Award
GREENSHIP [DR]
Certification Award
Points Required
Platinum
≥ 56
Gold
43 ≤ Points < 56
Silver
35 ≤ Points < 43
Bronze
27 ≤ Points < 35

What we can conclude that, GREENSHIP adopt the LEED system in the point of parameters used.  However, the assessment points are different each other.  This comparison can be useful as the comparison of rating system assessment that is adopting LEED system as its fundamental.


NB:  Green Act: 19.2 miles  = 0.640 gallons oil
        Cumulative 63.6 miles  = 2.105 gallons oil